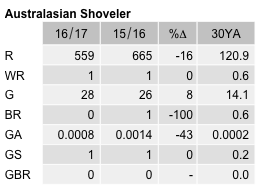
Australasian Shoveler
Spatula rhynchotis
ABR description
The following is extracted from the Annual Bird Report for the twelve months to June 2017.
Uncommon, breeding visitor
Can be seen throughout the year on larger bodies of water.
General: A small reduction in population indices from last year. This is reflected in a reduction in abundance (0.33 cf 0.49 last year) and a reduction in the reporting rate (4.0 cf 5.7 last year). Despite this there was an increase in the maximum number seen, 360/20 Feb LBath GrY08 (LeM1). Reported throughout the year but smaller numbers during the spring. Most commonly reported from the Bungendore area and JWNR/FSP and WBPD.
GBS. 1record, 2/Wk4 (Dec) Jerrabomberra GrM116 (HaL2), similar to the last 3 years.
Abundance
Abundance is the average number of birds of that species per survey. Where the species was observed (presence recorded) but the number of birds seen was not recorded, this is treated as a count of zero.
Abundance by year
This chart shows the abundance of Australasian Shoveler between 1982 and 2017. 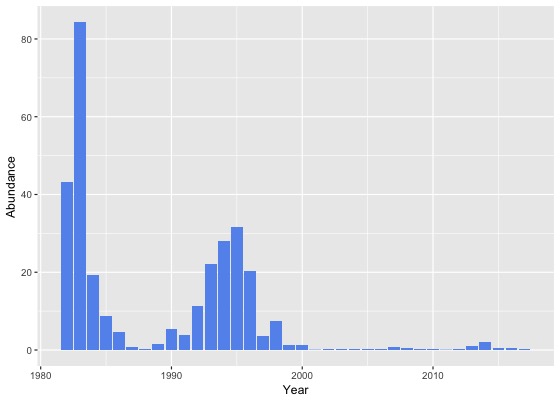
Abundance by month
This chart shows the monthly abundance of Australasian Shoveler. The blue lines show the abundance for the twelve months to June 2017 and the bars show the average abundance for the period 1982 to 2017. 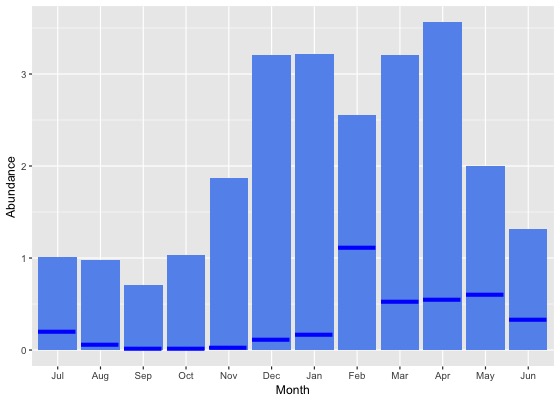
Abundance by season
This chart shows the seasonal abundance of Australasian Shoveler. The blue lines show the seasonal abundance for the twelve months to June 2017 and the bars show the average seasonal abundance for the period 1982 to 2017. 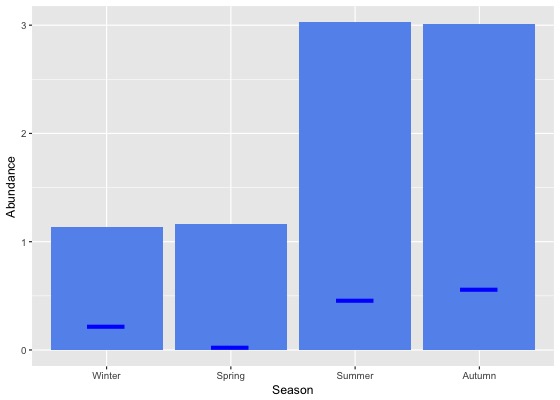
Abundance data
| Month | Season | ||||||||||||||||||
|---|---|---|---|---|---|---|---|---|---|---|---|---|---|---|---|---|---|---|---|
| Period | Jul | Aug | Sep | Oct | Nov | Dec | Jan | Feb | Mar | Apr | May | Jun | Winter | Spring | Summer | Autumn | All | ||
| All years | |||||||||||||||||||
| All | 1.0 | 1.0 | 0.7 | 1.0 | 1.9 | 3.2 | 3.2 | 2.6 | 3.2 | 3.6 | 2.0 | 1.3 | 1.1 | 1.2 | 3.0 | 3.0 | 2.1 | ||
| Previous years | |||||||||||||||||||
| All previous years | 1.1 | 1.2 | 0.8 | 1.2 | 2.2 | 3.7 | 3.8 | 2.9 | 3.7 | 4.0 | 2.3 | 1.5 | 1.3 | 1.3 | 3.5 | 3.5 | 2.4 | ||
| Previous 30 years | 1.0 | 1.1 | 0.7 | 1.0 | 1.8 | 3.3 | 3.5 | 2.3 | 3.6 | 3.8 | 2.2 | 1.2 | 1.1 | 1.1 | 3.1 | 3.3 | 2.2 | ||
| Previous 20 years | 0.6 | 0.7 | 0.5 | 0.5 | 0.7 | 0.8 | 1.1 | 0.7 | 0.6 | 0.9 | 1.0 | 0.5 | 0.6 | 0.5 | 0.9 | 0.8 | 0.7 | ||
| 10 year groups | |||||||||||||||||||
| [2007,2017) | 0.7 | 0.7 | 0.4 | 0.2 | 0.3 | 0.3 | 0.8 | 0.7 | 0.7 | 1.2 | 1.3 | 0.4 | 0.6 | 0.3 | 0.6 | 1.0 | 0.6 | ||
| [1997,2007) | 0.5 | 0.6 | 0.8 | 1.2 | 1.5 | 1.5 | 1.9 | 0.7 | 0.5 | 0.2 | 0.3 | 0.7 | 0.6 | 1.1 | 1.4 | 0.3 | 0.9 | ||
| [1987,1997) | 2.5 | 2.3 | 1.5 | 4.5 | 5.5 | 17.6 | 17.6 | 10.1 | 20.3 | 18.6 | 6.6 | 4.4 | 3.1 | 4.0 | 15.3 | 15.5 | 9.1 | ||
| 5 year groups | |||||||||||||||||||
| [2012,2017) | 0.7 | 0.6 | 0.5 | 0.3 | 0.3 | 0.4 | 0.8 | 0.7 | 0.9 | 1.6 | 1.6 | 0.6 | 0.6 | 0.3 | 0.7 | 1.3 | 0.7 | ||
| [2007,2012) | 0.4 | 1.1 | 0.2 | 0.2 | 0.3 | 0.2 | 1.0 | 0.4 | 0.2 | 0.3 | 0.5 | 0.1 | 0.4 | 0.2 | 0.5 | 0.3 | 0.3 | ||
| [2002,2007) | 0.3 | 0.5 | 0.1 | 0.2 | 0.1 | 0.1 | 0.6 | 0.3 | 0.3 | 0.2 | 0.3 | 0.2 | 0.3 | 0.1 | 0.3 | 0.3 | 0.2 | ||
| [1997,2002) | 0.9 | 0.6 | 1.6 | 2.6 | 3.1 | 3.5 | 3.4 | 1.1 | 0.8 | 0.2 | 0.2 | 1.4 | 1.0 | 2.4 | 2.8 | 0.4 | 1.7 | ||
| [1992,1997) | 7.4 | 6.5 | 4.3 | 11.6 | 14.1 | 54.1 | 43.4 | 29.6 | 48.2 | 41.3 | 17.2 | 11.6 | 8.5 | 10.4 | 43.2 | 36.6 | 23.6 | ||
| [1987,1992) | 0.3 | 0.1 | 0.1 | 0.6 | 1.4 | 1.6 | 3.4 | 2.7 | 3.7 | 5.7 | 1.2 | 0.3 | 0.2 | 0.8 | 2.6 | 3.6 | 1.7 | ||
| Year | |||||||||||||||||||
| 2017 | 0.2 | 0.1 | 0.0 | 0.0 | 0.0 | 0.1 | 0.2 | 1.1 | 0.5 | 0.6 | 0.6 | 0.3 | 0.2 | 0.0 | 0.5 | 0.6 | 0.3 | ||
| 2016 | 0.6 | 0.7 | 0.5 | 0.4 | 0.3 | 0.3 | 0.5 | 0.5 | 0.6 | 0.4 | 0.8 | 0.4 | 0.6 | 0.4 | 0.4 | 0.6 | 0.5 | ||
| 2015 | 1.4 | 0.5 | 0.8 | 0.3 | 0.3 | 0.4 | 0.3 | 0.2 | 0.4 | 0.3 | 0.4 | 0.4 | 0.7 | 0.5 | 0.3 | 0.4 | 0.4 | ||
| 2014 | 0.9 | 0.8 | 0.6 | 0.2 | 0.1 | 0.7 | 2.2 | 1.3 | 1.9 | 8.6 | 5.9 | 1.0 | 0.9 | 0.3 | 1.6 | 5.1 | 2.0 | ||
| 2013 | 0.5 | 0.7 | 0.4 | 0.3 | 0.5 | 0.6 | 1.2 | 1.7 | 1.7 | 2.0 | 3.3 | 0.7 | 0.6 | 0.4 | 1.1 | 2.1 | 1.1 | ||
| 2012 | 0.2 | 0.1 | 0.0 | 0.1 | 0.2 | 0.1 | 0.1 | 0.9 | 0.2 | 0.4 | 0.6 | 0.8 | 0.4 | 0.1 | 0.2 | 0.4 | 0.2 | ||
| 2011 | 0.2 | 0.3 | 0.0 | 0.1 | 0.0 | 0.0 | 0.2 | 0.1 | 0.0 | 0.1 | 0.4 | 0.1 | 0.2 | 0.0 | 0.1 | 0.1 | 0.1 | ||
| 2010 | 0.2 | 0.2 | 0.1 | 0.1 | 0.1 | 0.3 | 1.3 | 0.4 | 0.2 | 0.0 | 0.2 | 0.1 | 0.1 | 0.1 | 0.7 | 0.1 | 0.2 | ||
| 2009 | 0.4 | 0.7 | 0.2 | 0.1 | 0.5 | 0.0 | 0.5 | 0.2 | 0.2 | 0.0 | 0.7 | 0.1 | 0.3 | 0.2 | 0.2 | 0.2 | 0.2 | ||
| 2008 | 0.2 | 1.6 | 0.4 | 0.1 | 0.5 | 0.3 | 2.6 | 0.8 | 0.0 | 0.2 | 0.6 | 0.2 | 0.5 | 0.3 | 1.0 | 0.2 | 0.5 | ||
| 2007 | 1.6 | 3.0 | 0.1 | 0.5 | 0.2 | 0.4 | 1.3 | 1.0 | 0.4 | 1.1 | 0.9 | 0.2 | 1.1 | 0.4 | 0.9 | 0.8 | 0.7 | ||
| 2006 | 0.1 | 0.3 | 0.2 | 0.2 | 0.0 | 0.1 | 0.8 | 0.3 | 0.1 | 0.0 | 0.1 | 0.6 | 0.4 | 0.2 | 0.4 | 0.1 | 0.2 | ||
| 2005 | 0.3 | 0.0 | 0.1 | 0.1 | 0.1 | 0.0 | 0.8 | 0.1 | 0.5 | 0.2 | 0.4 | 0.0 | 0.1 | 0.1 | 0.3 | 0.4 | 0.2 | ||
| 2004 | 0.3 | 0.4 | 0.1 | 0.2 | 0.1 | 0.1 | 0.3 | 1.5 | 1.2 | 0.6 | 0.0 | 0.1 | 0.3 | 0.1 | 0.4 | 0.7 | 0.4 | ||
| 2003 | 0.6 | 0.2 | 0.1 | 0.1 | 0.1 | 0.1 | 0.6 | 0.0 | 0.1 | 0.1 | 0.3 | 0.0 | 0.2 | 0.1 | 0.2 | 0.1 | 0.1 | ||
| 2002 | 0.0 | 1.7 | 0.2 | 0.4 | 0.0 | 0.0 | 0.4 | 0.1 | 0.1 | 0.3 | 0.9 | 0.4 | 0.6 | 0.2 | 0.1 | 0.3 | 0.3 | ||
| 2001 | 0.0 | 0.0 | 0.0 | 0.1 | 0.4 | 0.0 | 0.0 | 0.4 | 0.1 | 0.4 | 0.0 | 0.1 | 0.0 | 0.1 | 0.1 | 0.1 | 0.1 | ||
| 2000 | 0.3 | 0.2 | 0.1 | 0.1 | 0.5 | 0.6 | 9.5 | 0.9 | 0.1 | 0.0 | 0.2 | 0.1 | 0.2 | 0.2 | 3.6 | 0.1 | 1.2 | ||
| 1999 | 0.5 | 0.1 | 0.1 | 0.0 | 1.2 | 2.1 | 0.3 | 0.2 | 3.1 | 0.0 | 0.2 | 4.3 | 2.7 | 0.4 | 0.9 | 1.1 | 1.2 | ||
| 1998 | 0.0 | 5.0 | 12.2 | 16.2 | 12.2 | 15.8 | 0.6 | 0.6 | 0.4 | 0.5 | 1.7 | 0.6 | 1.9 | 13.3 | 7.7 | 0.6 | 7.4 | ||
| 1997 | 4.5 | 0.1 | 0.5 | 7.3 | 5.6 | 10.4 | 0.1 | 7.2 | 0.6 | 0.3 | 0.0 | 0.2 | 1.9 | 4.2 | 7.1 | 0.3 | 3.5 | ||
| 1996 | 1.8 | 7.8 | 5.0 | 6.7 | 11.2 | 33.1 | 41.8 | 66.4 | 9.7 | 28.4 | 0.5 | 24.1 | 11.9 | 7.9 | 46.1 | 12.6 | 20.2 | ||
| 1995 | 14.6 | 7.8 | 5.3 | 19.7 | 31.9 | 113.7 | 35.9 | 0.4 | 75.0 | 42.9 | 28.4 | 13.4 | 11.5 | 19.3 | 53.1 | 49.7 | 31.7 | ||
| 1994 | 14.2 | 10.1 | 6.5 | 11.7 | 4.7 | 73.3 | 64.2 | 20.1 | 48.0 | 62.5 | 23.1 | 7.1 | 9.9 | 7.2 | 51.8 | 47.7 | 28.0 | ||
| 1993 | 3.3 | 3.2 | 0.2 | 8.5 | 0.3 | 18.2 | 81.3 | 15.8 | 79.1 | 30.0 | 19.5 | 4.7 | 3.7 | 3.3 | 42.0 | 44.6 | 22.1 | ||
| 1992 | 0.7 | 0.6 | 3.6 | 5.8 | 21.9 | 16.8 | 4.6 | 22.5 | 31.4 | 16.4 | 10.0 | 5.1 | 2.2 | 9.7 | 13.9 | 19.2 | 11.3 | ||
| 1991 | 0.5 | 0.1 | 0.3 | 1.1 | 1.8 | 4.9 | 8.3 | 12.3 | 5.6 | 13.5 | 9.2 | 0.9 | 0.4 | 1.1 | 8.0 | 9.4 | 3.9 | ||
| 1990 | 0.5 | 0.0 | 0.2 | 3.9 | 3.2 | 6.3 | 12.1 | 14.0 | 12.7 | 21.0 | 2.4 | 1.1 | 0.4 | 2.5 | 10.8 | 12.5 | 5.3 | ||
| 1989 | 0.0 | 0.1 | 0.1 | 0.3 | 2.5 | 0.8 | 0.5 | 1.3 | 6.4 | 8.6 | 0.2 | 0.1 | 0.1 | 0.9 | 0.9 | 5.4 | 1.7 | ||
| 1988 | 0.1 | 0.1 | 0.2 | 0.1 | 0.3 | 0.1 | 0.1 | 0.4 | 0.7 | 0.5 | 0.4 | 0.2 | 0.1 | 0.2 | 0.2 | 0.5 | 0.3 | ||
| 1987 | 2.7 | 1.1 | 0.0 | 0.0 | 1.0 | 1.3 | 5.0 | 0.1 | 0.0 | 0.2 | 0.1 | 0.1 | 0.3 | 0.4 | 2.0 | 0.1 | 0.7 | ||
| 1986 | 0.0 | 1.2 | 3.4 | 6.2 | 4.3 | 12.8 | 8.0 | 2.6 | 4.5 | 2.5 | 4.0 | 7.1 | 2.9 | 4.5 | 7.6 | 3.5 | 4.5 | ||
| 1985 | 13.0 | 0.9 | 0.3 | 1.7 | 5.9 | 8.2 | 33.4 | 7.8 | 11.8 | 15.1 | 13.4 | 43.0 | 18.4 | 2.6 | 10.5 | 13.8 | 8.7 | ||
| 1984 | 3.8 | 0.2 | 6.0 | 13.0 | 320.5 | 99.0 | 13.4 | 25.5 | 0.0 | 2.3 | 4.3 | 12.8 | 9.3 | 69.9 | 32.7 | 2.3 | 19.3 | ||
| 1983 | 35.7 | 31.5 | 150.2 | 74.6 | 98.9 | 72.4 | 260.7 | 146.7 | 328.5 | - | 36.9 | 0.2 | 20.5 | 96.7 | 137.3 | 78.6 | 84.2 | ||
| 1982 | - | 2.1 | - | 0.0 | 0.2 | 15.6 | - | 52.0 | - | 125.9 | - | 46.8 | 27.1 | 0.2 | 31.6 | 125.9 | 43.2 | ||
Reporting rates
Reporting rate is the proportion of all surveys in which the species was present.
Reporting rate by year
This chart shows the reporting rate of Australasian Shoveler each year between 1982 and 2017. 
Reporting rate by month
This chart shows the reporting rate by month of Australasian Shoveler. The blue lines show the reporting rate for the twelve months to June 2017 and the bars show the average reporting rate for the period 1982 to 2017. 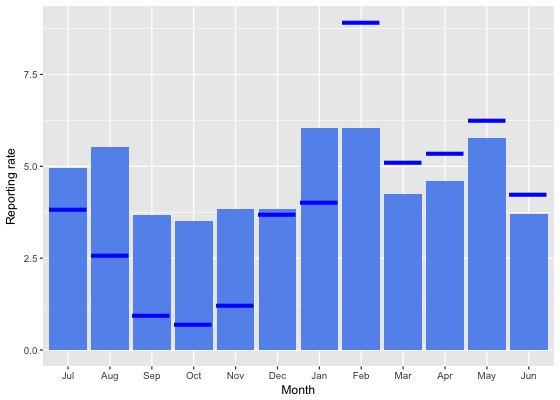
Reporting rate by season
This chart shows the seasonal reporting rate of Australasian Shoveler. The blue lines show the seasonal reporting rate for the twelve months to June 2017 and the bars show the average seasonal reporting rate for the period 1982 to 2017. 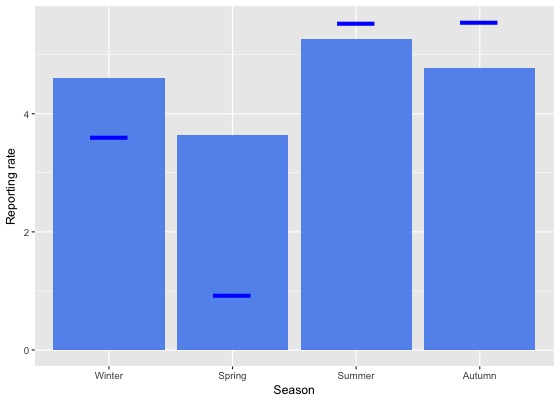
Reporting rate data
| Month | Season | ||||||||||||||||||
|---|---|---|---|---|---|---|---|---|---|---|---|---|---|---|---|---|---|---|---|
| Period | Jul | Aug | Sep | Oct | Nov | Dec | Jan | Feb | Mar | Apr | May | Jun | Winter | Spring | Summer | Autumn | All | ||
| All years | |||||||||||||||||||
| All | 5.0 | 5.5 | 3.7 | 3.5 | 3.8 | 3.8 | 6.0 | 6.0 | 4.2 | 4.6 | 5.8 | 3.7 | 4.6 | 3.6 | 5.3 | 4.8 | 4.5 | ||
| Previous years | |||||||||||||||||||
| All previous years | 5.1 | 6.1 | 4.0 | 3.9 | 4.3 | 3.8 | 6.4 | 5.4 | 4.1 | 4.5 | 5.7 | 3.6 | 4.8 | 4.0 | 5.2 | 4.6 | 4.6 | ||
| Previous 30 years | 4.9 | 5.9 | 4.0 | 3.8 | 4.1 | 3.6 | 6.2 | 5.1 | 4.0 | 4.3 | 5.5 | 3.3 | 4.5 | 3.9 | 5.0 | 4.5 | 4.4 | ||
| Previous 20 years | 4.8 | 6.3 | 4.0 | 3.8 | 4.4 | 3.3 | 6.0 | 5.1 | 3.6 | 3.7 | 5.4 | 2.9 | 4.4 | 4.0 | 4.8 | 4.1 | 4.3 | ||
| 10 year groups | |||||||||||||||||||
| [2007,2017) | 5.6 | 7.1 | 4.5 | 3.6 | 5.3 | 3.9 | 6.0 | 5.1 | 3.9 | 4.2 | 5.8 | 3.1 | 4.9 | 4.3 | 5.0 | 4.5 | 4.6 | ||
| [1997,2007) | 3.4 | 4.6 | 2.9 | 4.5 | 2.7 | 2.2 | 6.2 | 5.0 | 3.0 | 2.4 | 4.4 | 2.5 | 3.3 | 3.4 | 4.2 | 3.1 | 3.5 | ||
| [1987,1997) | 5.4 | 4.6 | 3.8 | 3.6 | 3.0 | 5.2 | 7.4 | 5.0 | 6.2 | 7.3 | 5.8 | 5.1 | 5.0 | 3.4 | 5.9 | 6.5 | 5.1 | ||
| 5 year groups | |||||||||||||||||||
| [2012,2017) | 6.3 | 7.5 | 4.7 | 4.0 | 5.7 | 4.9 | 6.1 | 5.5 | 4.9 | 5.2 | 6.1 | 3.8 | 5.7 | 4.7 | 5.5 | 5.3 | 5.3 | ||
| [2007,2012) | 3.7 | 5.4 | 4.2 | 2.8 | 4.0 | 1.8 | 5.6 | 3.4 | 1.2 | 1.8 | 5.0 | 1.9 | 3.1 | 3.4 | 3.5 | 2.3 | 3.1 | ||
| [2002,2007) | 3.7 | 6.1 | 3.4 | 5.1 | 2.8 | 2.1 | 9.1 | 5.8 | 3.6 | 3.0 | 6.7 | 2.1 | 3.7 | 3.9 | 5.1 | 4.1 | 4.2 | ||
| [1997,2002) | 2.8 | 2.8 | 2.2 | 3.5 | 2.6 | 2.3 | 3.0 | 4.3 | 2.2 | 1.7 | 1.5 | 2.9 | 2.9 | 2.7 | 3.1 | 1.9 | 2.6 | ||
| [1992,1997) | 11.1 | 8.1 | 6.9 | 5.4 | 5.5 | 6.7 | 13.3 | 6.5 | 9.8 | 10.5 | 8.4 | 8.8 | 9.2 | 5.9 | 9.2 | 9.6 | 8.3 | ||
| [1987,1992) | 2.9 | 2.6 | 2.4 | 2.6 | 1.8 | 4.5 | 4.2 | 4.4 | 4.0 | 5.5 | 4.5 | 3.0 | 2.8 | 2.2 | 4.4 | 4.7 | 3.4 | ||
| Year | |||||||||||||||||||
| 2017 | 3.8 | 2.6 | 0.9 | 0.7 | 1.2 | 3.7 | 4.0 | 8.9 | 5.1 | 5.4 | 6.2 | 4.2 | 3.6 | 0.9 | 5.5 | 5.5 | 4.0 | ||
| 2016 | 6.9 | 8.6 | 4.7 | 5.0 | 5.8 | 4.9 | 5.0 | 6.3 | 5.1 | 6.3 | 6.5 | 4.0 | 6.5 | 5.1 | 5.4 | 5.9 | 5.7 | ||
| 2015 | 6.8 | 5.8 | 6.1 | 5.8 | 6.3 | 6.4 | 4.9 | 3.7 | 4.9 | 4.6 | 5.0 | 3.1 | 4.8 | 6.0 | 5.0 | 4.8 | 5.2 | ||
| 2014 | 3.6 | 7.6 | 6.0 | 4.4 | 3.7 | 4.6 | 9.4 | 7.0 | 4.4 | 6.4 | 7.0 | 2.9 | 4.5 | 4.7 | 7.7 | 5.7 | 5.8 | ||
| 2013 | 10.0 | 9.5 | 5.0 | 1.7 | 7.4 | 4.8 | 7.8 | 4.7 | 5.7 | 5.1 | 7.5 | 5.4 | 8.1 | 4.2 | 5.9 | 5.9 | 5.7 | ||
| 2012 | 2.4 | 5.5 | 0.5 | 1.7 | 4.4 | 1.9 | 4.4 | 5.9 | 3.6 | 1.7 | 4.3 | 4.8 | 4.3 | 2.0 | 3.8 | 2.9 | 3.1 | ||
| 2011 | 4.9 | 3.2 | 0.8 | 0.4 | 0.0 | 0.3 | 2.7 | 1.4 | 0.3 | 1.6 | 2.2 | 2.3 | 3.0 | 0.4 | 1.5 | 1.3 | 1.4 | ||
| 2010 | 4.2 | 6.1 | 6.7 | 2.5 | 2.9 | 3.6 | 7.2 | 2.4 | 1.6 | 2.1 | 2.0 | 1.5 | 3.2 | 3.8 | 4.8 | 1.9 | 3.4 | ||
| 2009 | 1.4 | 9.4 | 5.3 | 2.6 | 5.4 | 1.1 | 11.3 | 1.7 | 1.9 | 0.4 | 8.4 | 1.4 | 3.1 | 3.9 | 4.6 | 2.7 | 3.6 | ||
| 2008 | 3.4 | 5.2 | 4.5 | 4.3 | 8.1 | 2.3 | 7.9 | 11.1 | 1.6 | 1.9 | 8.1 | 2.3 | 3.4 | 4.9 | 5.9 | 2.9 | 4.3 | ||
| 2007 | 5.5 | 3.7 | 3.7 | 4.1 | 4.1 | 2.0 | 3.5 | 2.6 | 1.3 | 3.0 | 7.3 | 2.0 | 3.0 | 4.0 | 2.7 | 3.2 | 3.3 | ||
| 2006 | 2.0 | 4.9 | 3.5 | 3.3 | 2.4 | 2.2 | 11.2 | 13.3 | 3.8 | 1.6 | 5.1 | 3.1 | 3.1 | 3.2 | 8.5 | 3.5 | 4.3 | ||
| 2005 | 4.4 | 3.7 | 3.7 | 3.3 | 4.1 | 1.2 | 9.2 | 4.3 | 4.8 | 2.7 | 12.4 | 1.1 | 2.6 | 3.7 | 4.1 | 6.7 | 4.4 | ||
| 2004 | 6.0 | 9.9 | 3.4 | 5.8 | 4.1 | 3.7 | 6.1 | 9.1 | 4.7 | 3.8 | 1.9 | 1.2 | 5.6 | 4.3 | 5.6 | 3.8 | 4.9 | ||
| 2003 | 5.1 | 5.8 | 4.2 | 9.8 | 3.2 | 2.5 | 5.2 | 1.6 | 2.7 | 2.3 | 4.7 | 2.5 | 4.3 | 5.6 | 2.9 | 3.0 | 4.0 | ||
| 2002 | 0.6 | 5.1 | 2.0 | 5.2 | 0.5 | 1.5 | 13.2 | 2.6 | 1.8 | 4.8 | 4.7 | 2.7 | 2.5 | 2.7 | 4.6 | 3.4 | 3.4 | ||
| 2001 | 0.9 | 0.6 | 0.6 | 2.9 | 0.6 | 0.0 | 1.5 | 3.6 | 2.1 | 2.0 | 0.6 | 2.5 | 1.3 | 1.3 | 1.5 | 1.7 | 1.5 | ||
| 2000 | 2.4 | 3.3 | 1.4 | 1.8 | 2.8 | 1.7 | 3.7 | 1.9 | 2.0 | 0.4 | 1.8 | 1.1 | 2.2 | 2.0 | 2.4 | 1.4 | 2.0 | ||
| 1999 | 5.9 | 4.1 | 1.1 | 1.3 | 2.6 | 3.1 | 2.2 | 4.3 | 2.2 | 1.5 | 2.3 | 5.1 | 4.9 | 1.6 | 3.2 | 2.0 | 2.7 | ||
| 1998 | 0.0 | 7.5 | 5.7 | 9.8 | 5.3 | 2.8 | 5.9 | 5.7 | 2.2 | 2.6 | 3.7 | 4.0 | 4.2 | 6.7 | 4.4 | 2.5 | 4.9 | ||
| 1997 | 8.0 | 1.7 | 6.4 | 7.9 | 2.6 | 8.7 | 3.9 | 14.0 | 5.0 | 3.7 | 0.0 | 1.4 | 4.1 | 5.3 | 9.0 | 3.1 | 5.4 | ||
| 1996 | 9.0 | 5.3 | 6.7 | 1.8 | 3.7 | 5.1 | 11.7 | 4.7 | 5.9 | 10.9 | 12.1 | 9.2 | 7.7 | 3.7 | 7.3 | 8.9 | 6.7 | ||
| 1995 | 9.7 | 7.8 | 2.9 | 6.1 | 3.6 | 8.0 | 13.3 | 3.2 | 12.2 | 8.1 | 6.5 | 6.4 | 7.9 | 4.5 | 9.1 | 9.0 | 7.4 | ||
| 1994 | 17.6 | 9.1 | 8.8 | 3.5 | 4.4 | 4.3 | 17.6 | 5.2 | 10.2 | 10.7 | 10.0 | 5.6 | 9.7 | 5.2 | 9.9 | 10.4 | 8.6 | ||
| 1993 | 12.2 | 11.5 | 4.8 | 12.0 | 6.1 | 8.7 | 10.2 | 15.6 | 7.4 | 11.7 | 6.5 | 15.9 | 13.3 | 7.9 | 11.0 | 8.3 | 9.9 | ||
| 1992 | 9.2 | 7.4 | 11.8 | 5.3 | 12.5 | 7.9 | 13.8 | 9.8 | 14.1 | 13.6 | 7.9 | 8.3 | 8.4 | 9.6 | 10.5 | 11.7 | 10.0 | ||
| 1991 | 3.9 | 1.1 | 5.8 | 4.9 | 3.1 | 5.4 | 14.3 | 14.0 | 6.3 | 15.3 | 16.4 | 6.0 | 3.3 | 4.5 | 10.6 | 12.6 | 7.0 | ||
| 1990 | 2.6 | 2.2 | 2.2 | 3.1 | 1.9 | 12.5 | 8.3 | 9.9 | 9.1 | 10.7 | 6.8 | 3.9 | 2.6 | 2.3 | 10.2 | 9.0 | 5.3 | ||
| 1989 | 2.0 | 3.9 | 2.2 | 1.9 | 1.5 | 4.3 | 1.6 | 3.1 | 4.4 | 4.1 | 3.3 | 2.4 | 2.9 | 1.9 | 3.1 | 4.0 | 2.9 | ||
| 1988 | 2.2 | 1.5 | 3.4 | 3.1 | 1.4 | 2.1 | 3.5 | 2.3 | 1.5 | 6.4 | 3.0 | 2.4 | 2.0 | 2.5 | 2.6 | 3.6 | 2.6 | ||
| 1987 | 27.3 | 20.0 | 0.8 | 1.6 | 1.8 | 3.8 | 3.1 | 3.3 | 3.3 | 1.6 | 2.6 | 2.9 | 5.2 | 1.4 | 3.4 | 2.5 | 2.6 | ||
| 1986 | 0.0 | 13.2 | 5.7 | 11.1 | 8.5 | 14.7 | 17.4 | 16.7 | 9.7 | 5.9 | 10.3 | 14.3 | 10.1 | 8.1 | 16.1 | 8.1 | 10.3 | ||
| 1985 | 13.3 | 10.0 | 5.8 | 5.8 | 7.0 | 8.3 | 62.5 | 35.3 | 36.4 | 36.8 | 30.0 | 21.4 | 14.8 | 6.2 | 18.8 | 35.0 | 13.5 | ||
| 1984 | 80.0 | 10.0 | 20.0 | 33.3 | 75.0 | 41.7 | 13.8 | 15.2 | 0.0 | 14.7 | 12.9 | 20.6 | 24.5 | 38.1 | 18.9 | 9.8 | 18.2 | ||
| 1983 | 83.3 | 41.7 | 80.0 | 53.8 | 55.6 | 30.8 | 83.3 | 45.5 | 100.0 | - | 33.3 | 9.1 | 37.9 | 59.3 | 46.7 | 42.9 | 47.0 | ||
| 1982 | - | 27.3 | - | 0.0 | 12.5 | 35.7 | - | 45.5 | - | 53.8 | - | 42.9 | 36.0 | 11.1 | 40.0 | 53.8 | 37.5 | ||
Breeding data
Breeding records by month
Number of breeding records by breeding code and month, 2017 and all years| Breeding code | Jul | Aug | Sep | Oct | Nov | Dec | Jan | Feb | Mar | Apr | May | Jun |
|---|---|---|---|---|---|---|---|---|---|---|---|---|
| 2017 | ||||||||||||
| Breeding (BLA code) | 0 | 0 | 0 | 0 | 0 | 0 | 0 | 0 | 0 | 0 | 0 | 0 |
| Carrying Food | 0 | 0 | 0 | 0 | 0 | 0 | 0 | 0 | 0 | 0 | 0 | 0 |
| Copulating | 0 | 0 | 0 | 0 | 0 | 0 | 0 | 0 | 0 | 0 | 0 | 0 |
| Display | 0 | 0 | 0 | 0 | 0 | 0 | 0 | 0 | 0 | 0 | 0 | 0 |
| Dependent young | 0 | 0 | 0 | 0 | 0 | 0 | 0 | 0 | 0 | 0 | 0 | 0 |
| Faecal sac | 0 | 0 | 0 | 0 | 0 | 0 | 0 | 0 | 0 | 0 | 0 | 0 |
| Inspecting hollow | 0 | 0 | 0 | 0 | 0 | 0 | 0 | 0 | 0 | 0 | 0 | 0 |
| Nest building | 0 | 0 | 0 | 0 | 0 | 0 | 0 | 0 | 0 | 0 | 0 | 0 |
| Nest with eggs | 0 | 0 | 0 | 0 | 0 | 0 | 0 | 0 | 0 | 0 | 0 | 0 |
| Nest with young | 0 | 0 | 0 | 0 | 0 | 0 | 0 | 0 | 0 | 0 | 0 | 0 |
| On/leaving nest | 0 | 0 | 0 | 0 | 0 | 0 | 0 | 0 | 0 | 0 | 0 | 0 |
| All years | ||||||||||||
| Breeding (BLA code) | 0 | 0 | 0 | 3 | 0 | 0 | 0 | 0 | 0 | 0 | 0 | 0 |
| Carrying Food | 0 | 0 | 0 | 0 | 0 | 0 | 0 | 0 | 0 | 0 | 0 | 0 |
| Copulating | 0 | 0 | 0 | 0 | 0 | 0 | 0 | 0 | 0 | 0 | 0 | 0 |
| Display | 0 | 0 | 1 | 0 | 0 | 0 | 0 | 0 | 0 | 0 | 0 | 0 |
| Dependent young | 0 | 0 | 0 | 8 | 2 | 4 | 0 | 1 | 0 | 0 | 0 | 0 |
| Faecal sac | 0 | 0 | 0 | 0 | 0 | 0 | 0 | 0 | 0 | 0 | 0 | 0 |
| Inspecting hollow | 0 | 0 | 0 | 0 | 0 | 0 | 0 | 0 | 0 | 0 | 0 | 0 |
| Nest building | 0 | 0 | 0 | 0 | 0 | 0 | 0 | 0 | 0 | 0 | 0 | 0 |
| Nest with eggs | 0 | 0 | 0 | 0 | 0 | 0 | 0 | 0 | 0 | 0 | 0 | 0 |
| Nest with young | 0 | 0 | 0 | 0 | 0 | 0 | 0 | 0 | 0 | 0 | 0 | 0 |
| On/leaving nest | 0 | 0 | 0 | 0 | 0 | 0 | 0 | 0 | 0 | 0 | 0 | 0 |
Breeding records by year
Average number of breeding records per period by breeding code| Period | Breeding (BLA code) | Carrying Food | Copulating | Display | Dependent young | Faecal sac | Inspecting hollow | Nest building | Nest with eggs | Nest with young | On/leaving nest |
|---|---|---|---|---|---|---|---|---|---|---|---|
| All years | |||||||||||
| All | 0.1 | 0.0 | 0.0 | 0.0 | 0.4 | 0.0 | 0.0 | 0.0 | 0.0 | 0.0 | 0.0 |
| Previous years | |||||||||||
| All previous years | 0.1 | 0.0 | 0.0 | 0.0 | 0.4 | 0.0 | 0.0 | 0.0 | 0.0 | 0.0 | 0.0 |
| Previous 30 years | 0.1 | 0.0 | 0.0 | 0.0 | 0.4 | 0.0 | 0.0 | 0.0 | 0.0 | 0.0 | 0.0 |
| Previous 20 years | 0.1 | 0.0 | 0.0 | 0.0 | 0.4 | 0.0 | 0.0 | 0.0 | 0.0 | 0.0 | 0.0 |
| 10 year groups | |||||||||||
| [2007,2017) | 0.2 | 0.0 | 0.0 | 0.0 | 0.7 | 0.0 | 0.0 | 0.0 | 0.0 | 0.0 | 0.0 |
| [1997,2007) | 0.1 | 0.0 | 0.0 | 0.1 | 0.1 | 0.0 | 0.0 | 0.0 | 0.0 | 0.0 | 0.0 |
| [1987,1997) | 0.0 | 0.0 | 0.0 | 0.0 | 0.5 | 0.0 | 0.0 | 0.0 | 0.0 | 0.0 | 0.0 |
| 5 year groups | |||||||||||
| [2012,2017) | 0.2 | 0.0 | 0.0 | 0.0 | 0.6 | 0.0 | 0.0 | 0.0 | 0.0 | 0.0 | 0.0 |
| [2007,2012) | 0.2 | 0.0 | 0.0 | 0.0 | 0.8 | 0.0 | 0.0 | 0.0 | 0.0 | 0.0 | 0.0 |
| [2002,2007) | 0.0 | 0.0 | 0.0 | 0.0 | 0.0 | 0.0 | 0.0 | 0.0 | 0.0 | 0.0 | 0.0 |
| [1997,2002) | 0.2 | 0.0 | 0.0 | 0.2 | 0.2 | 0.0 | 0.0 | 0.0 | 0.0 | 0.0 | 0.0 |
| [1992,1997) | 0.0 | 0.0 | 0.0 | 0.0 | 0.0 | 0.0 | 0.0 | 0.0 | 0.0 | 0.0 | 0.0 |
| [1987,1992) | 0.0 | 0.0 | 0.0 | 0.0 | 1.0 | 0.0 | 0.0 | 0.0 | 0.0 | 0.0 | 0.0 |
| Year | |||||||||||
| 2017 | 0.0 | 0.0 | 0.0 | 0.0 | 0.0 | 0.0 | 0.0 | 0.0 | 0.0 | 0.0 | 0.0 |
| 2016 | 0.0 | 0.0 | 0.0 | 0.0 | 1.0 | 0.0 | 0.0 | 0.0 | 0.0 | 0.0 | 0.0 |
| 2015 | 0.0 | 0.0 | 0.0 | 0.0 | 0.0 | 0.0 | 0.0 | 0.0 | 0.0 | 0.0 | 0.0 |
| 2014 | 0.0 | 0.0 | 0.0 | 0.0 | 1.0 | 0.0 | 0.0 | 0.0 | 0.0 | 0.0 | 0.0 |
| 2013 | 0.0 | 0.0 | 0.0 | 0.0 | 0.0 | 0.0 | 0.0 | 0.0 | 0.0 | 0.0 | 0.0 |
| 2012 | 1.0 | 0.0 | 0.0 | 0.0 | 1.0 | 0.0 | 0.0 | 0.0 | 0.0 | 0.0 | 0.0 |
| 2011 | 0.0 | 0.0 | 0.0 | 0.0 | 1.0 | 0.0 | 0.0 | 0.0 | 0.0 | 0.0 | 0.0 |
| 2010 | 0.0 | 0.0 | 0.0 | 0.0 | 0.0 | 0.0 | 0.0 | 0.0 | 0.0 | 0.0 | 0.0 |
| 2009 | 1.0 | 0.0 | 0.0 | 0.0 | 2.0 | 0.0 | 0.0 | 0.0 | 0.0 | 0.0 | 0.0 |
| 2008 | 0.0 | 0.0 | 0.0 | 0.0 | 0.0 | 0.0 | 0.0 | 0.0 | 0.0 | 0.0 | 0.0 |
| 2007 | 0.0 | 0.0 | 0.0 | 0.0 | 1.0 | 0.0 | 0.0 | 0.0 | 0.0 | 0.0 | 0.0 |
| 2006 | 0.0 | 0.0 | 0.0 | 0.0 | 0.0 | 0.0 | 0.0 | 0.0 | 0.0 | 0.0 | 0.0 |
| 2005 | 0.0 | 0.0 | 0.0 | 0.0 | 0.0 | 0.0 | 0.0 | 0.0 | 0.0 | 0.0 | 0.0 |
| 2004 | 0.0 | 0.0 | 0.0 | 0.0 | 0.0 | 0.0 | 0.0 | 0.0 | 0.0 | 0.0 | 0.0 |
| 2003 | 0.0 | 0.0 | 0.0 | 0.0 | 0.0 | 0.0 | 0.0 | 0.0 | 0.0 | 0.0 | 0.0 |
| 2002 | 0.0 | 0.0 | 0.0 | 0.0 | 0.0 | 0.0 | 0.0 | 0.0 | 0.0 | 0.0 | 0.0 |
| 2001 | 0.0 | 0.0 | 0.0 | 1.0 | 0.0 | 0.0 | 0.0 | 0.0 | 0.0 | 0.0 | 0.0 |
| 2000 | 0.0 | 0.0 | 0.0 | 0.0 | 0.0 | 0.0 | 0.0 | 0.0 | 0.0 | 0.0 | 0.0 |
| 1999 | 0.0 | 0.0 | 0.0 | 0.0 | 0.0 | 0.0 | 0.0 | 0.0 | 0.0 | 0.0 | 0.0 |
| 1998 | 0.0 | 0.0 | 0.0 | 0.0 | 0.0 | 0.0 | 0.0 | 0.0 | 0.0 | 0.0 | 0.0 |
| 1997 | 1.0 | 0.0 | 0.0 | 0.0 | 1.0 | 0.0 | 0.0 | 0.0 | 0.0 | 0.0 | 0.0 |
| 1996 | 0.0 | 0.0 | 0.0 | 0.0 | 0.0 | 0.0 | 0.0 | 0.0 | 0.0 | 0.0 | 0.0 |
| 1995 | 0.0 | 0.0 | 0.0 | 0.0 | 0.0 | 0.0 | 0.0 | 0.0 | 0.0 | 0.0 | 0.0 |
| 1994 | 0.0 | 0.0 | 0.0 | 0.0 | 0.0 | 0.0 | 0.0 | 0.0 | 0.0 | 0.0 | 0.0 |
| 1993 | 0.0 | 0.0 | 0.0 | 0.0 | 0.0 | 0.0 | 0.0 | 0.0 | 0.0 | 0.0 | 0.0 |
| 1992 | 0.0 | 0.0 | 0.0 | 0.0 | 0.0 | 0.0 | 0.0 | 0.0 | 0.0 | 0.0 | 0.0 |
| 1991 | 0.0 | 0.0 | 0.0 | 0.0 | 0.0 | 0.0 | 0.0 | 0.0 | 0.0 | 0.0 | 0.0 |
| 1990 | 0.0 | 0.0 | 0.0 | 0.0 | 0.0 | 0.0 | 0.0 | 0.0 | 0.0 | 0.0 | 0.0 |
| 1989 | 0.0 | 0.0 | 0.0 | 0.0 | 4.0 | 0.0 | 0.0 | 0.0 | 0.0 | 0.0 | 0.0 |
| 1988 | 0.0 | 0.0 | 0.0 | 0.0 | 0.0 | 0.0 | 0.0 | 0.0 | 0.0 | 0.0 | 0.0 |
| 1987 | 0.0 | 0.0 | 0.0 | 0.0 | 1.0 | 0.0 | 0.0 | 0.0 | 0.0 | 0.0 | 0.0 |
| 1986 | 0.0 | 0.0 | 0.0 | 0.0 | 1.0 | 0.0 | 0.0 | 0.0 | 0.0 | 0.0 | 0.0 |
| 1985 | 0.0 | 0.0 | 0.0 | 0.0 | 0.0 | 0.0 | 0.0 | 0.0 | 0.0 | 0.0 | 0.0 |
| 1984 | 0.0 | 0.0 | 0.0 | 0.0 | 1.0 | 0.0 | 0.0 | 0.0 | 0.0 | 0.0 | 0.0 |
| 1983 | 0.0 | 0.0 | 0.0 | 0.0 | 0.0 | 0.0 | 0.0 | 0.0 | 0.0 | 0.0 | 0.0 |
| 1982 | 0.0 | 0.0 | 0.0 | 0.0 | 0.0 | 0.0 | 0.0 | 0.0 | 0.0 | 0.0 | 0.0 |
Distribution map
Distribution - 2017
This map shows the observed distribution of the Australasian Shoveler for 2017.
The red circles are the grid cells where Australasian Shoveler have been reported.
The transparency of the red circles indicate how many surveys sheets were submitted for that grid cell; the darker the red the more reliable the data. Of the 315 grid cells with reports, 83 had only one sheet; an example is grid number R17.
The size of the circle represents the reporting rate. The maximum reporting rate for Australasian Shoveler was 100.0% (eg grid number R17) and the minimum was 0.1% (eg grid number K13). 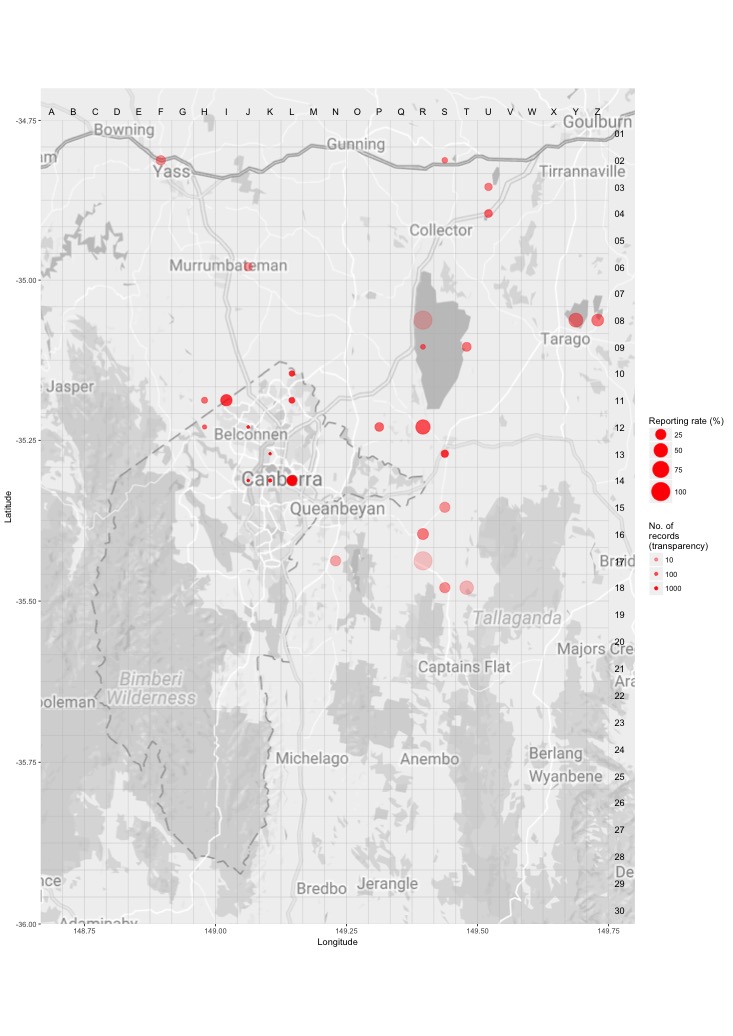
Distribution - all years
This map shows the observed distribution of the Australasian Shoveler for all years.
The red circles are the grid cells where Australasian Shoveler have been reported.
The transparency of the red circles indicate how many surveys sheets were submitted for that grid cell; the darker the red the more reliable the data. Of the 703 grid cells with reports, 55 had only one sheet; an example is grid number A12.
The size of the circle represents the reporting rate. The maximum reporting rate for Australasian Shoveler was 65.8% (eg grid number Y8) and the minimum was 0.1% (eg grid number I15). 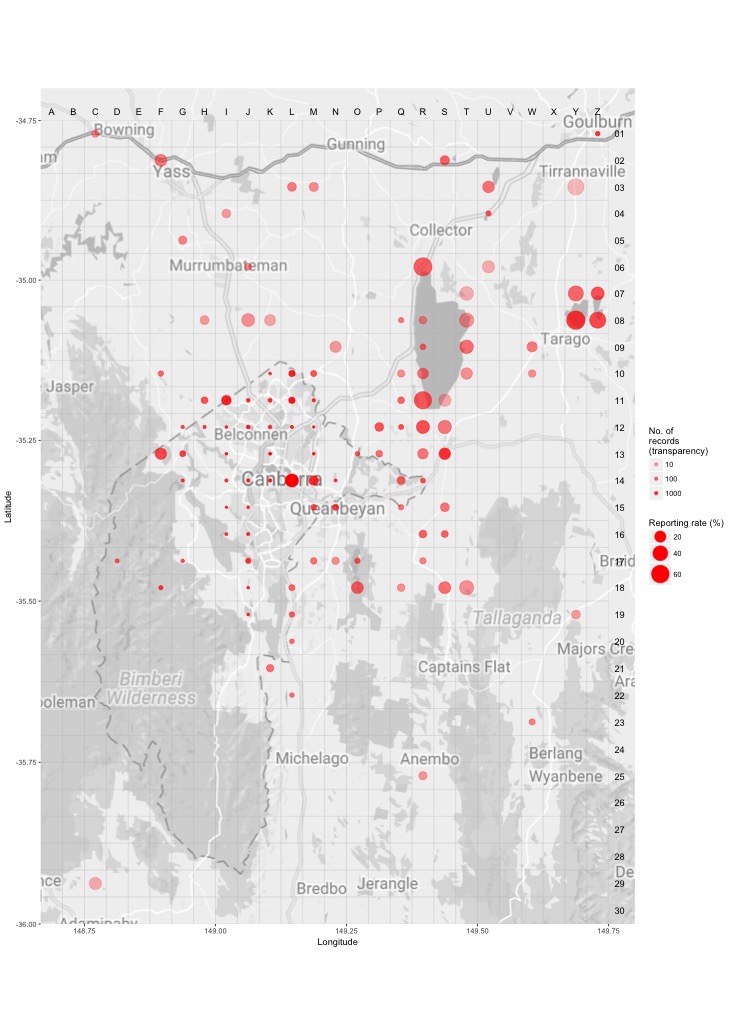
Breeding map
Breeding - 2017
This map shows the breeding distribution of the Australasian Shoveler for 2017.
The red circles are the grid cells where breeding activity for Australasian Shoveler have been reported.
The size of the circle represents the number of reports. 
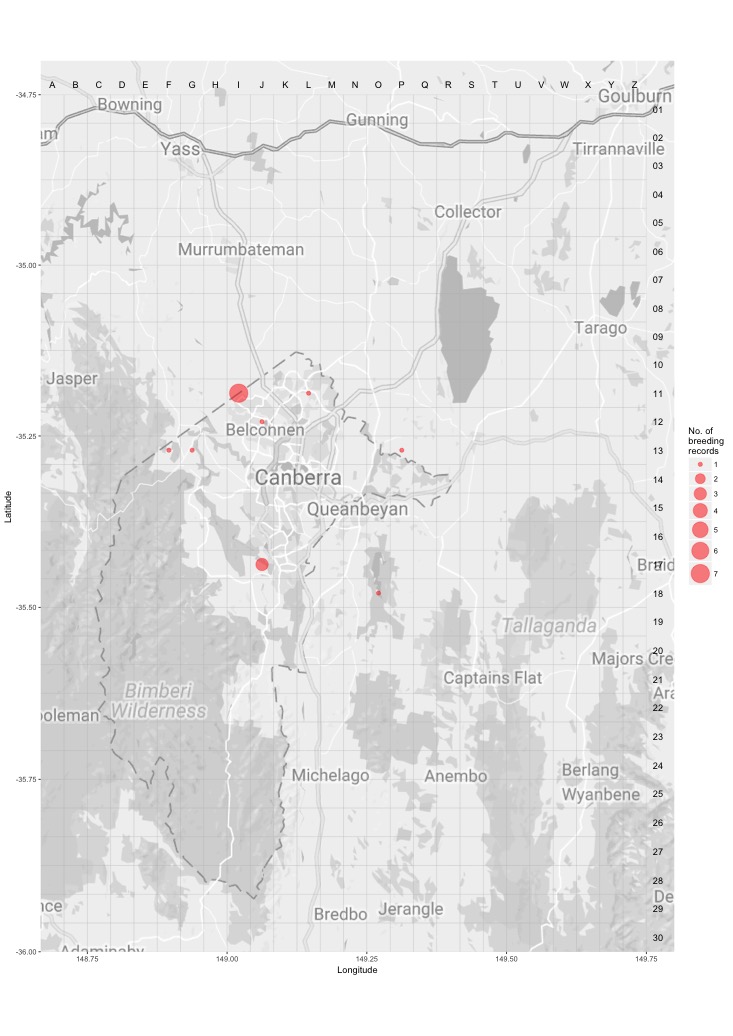
Breeding - all years
This map shows the breeding distribution of the Australasian Shoveler for all years.
The red circles are the grid cells where breeding activity for Australasian Shoveler have been reported.
The size of the circle represents the number of reports.